
Optimizing the manufacture of an object requires an understanding of design options, mechanical and physical principles, and 3D printing tradeoffs.
3D Printing Tradeoffs and Optimization
There are four areas where tradeoffs are commonly made in 3D printing:
- conventional and additive manufacturing processes
- additive manufacturing processes
- 3D printer selection
- different parameter settings in a 3D printer’s build process
The most common design goals considered for 3D printing tradeoffs are strength, speed of printing, minimum feature resolution, and cost. The same 3D model can be manufactured using different processes and parameter settings to optimize one or more these aspects of the finished design. Making the right 3D printing tradeoffs for optimum results requires an understanding of design principles and the possibilities inherent in the process.
Conventional vs. Additive Tradeoff
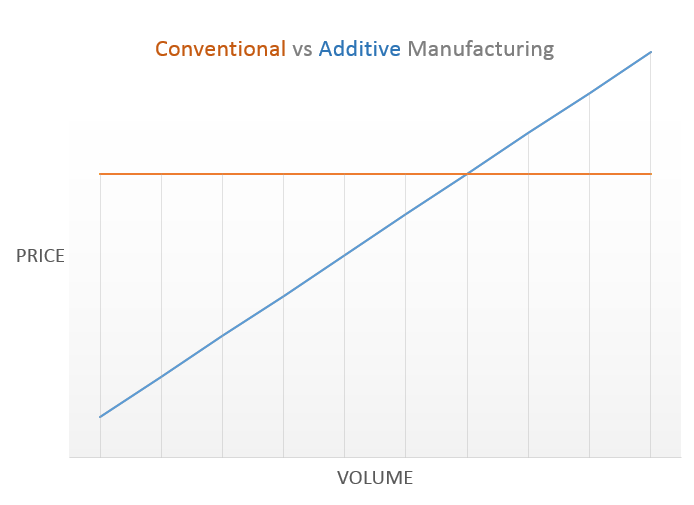 The first high level tradeoff that is offered by 3D printing is the tradeoff is between lowering the manufacturing entry cost or lowering the base cost per unit. Traditional or conventional manufacturing requires a high capital cost to produce a high volume of units very cheaply while 3D printing or additive manufacturing requires very little setup cost to produce each unit around the same price point. The break-even point is located at the intersection at the lines. The goal is to choose the right process for the desired volume and the cheapest method.
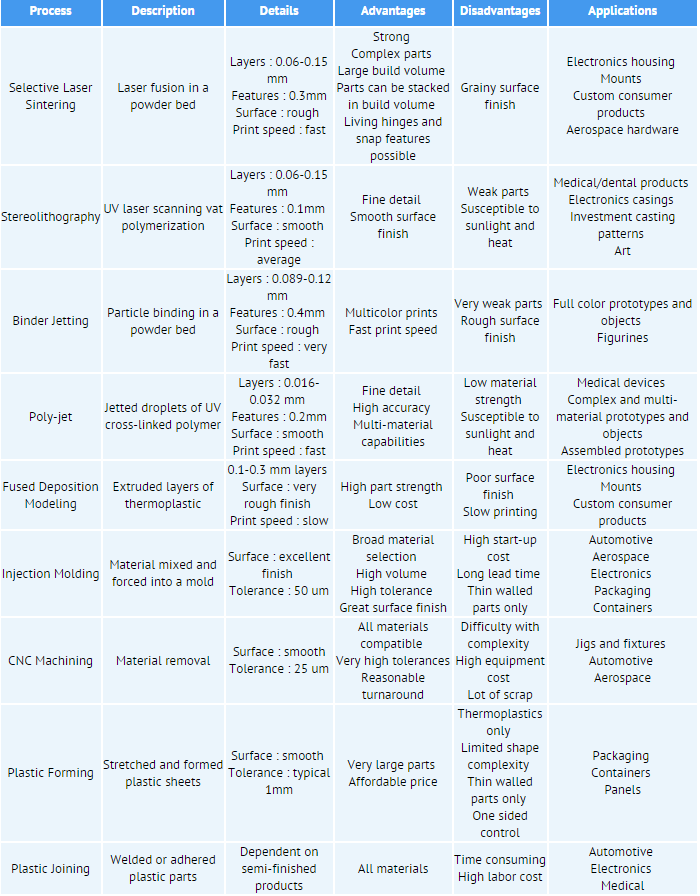
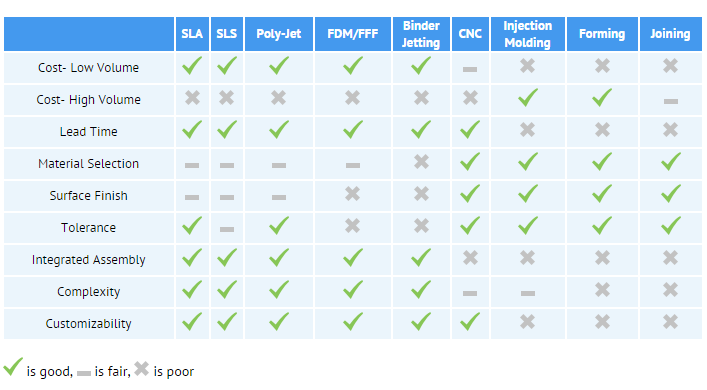
Tradeoffs between Processes
3D printing is a broad umbrella term for several different processes that perform additive manufacturing. Here are two tables from Sculpteo’s 3D Printing and Traditional Manufacturing Processes that highlight the tradeoffs between the processes.
3D printers’ Tradeoffs
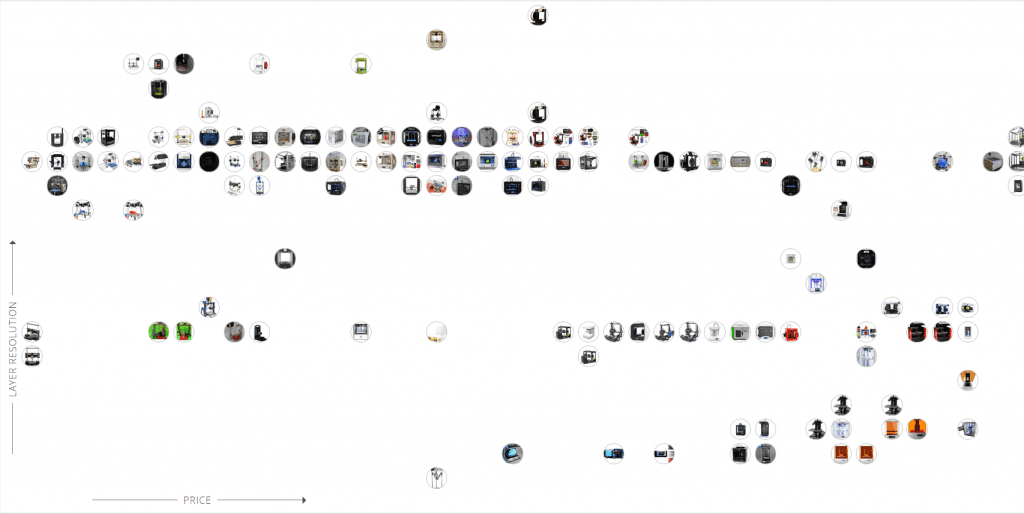
The next tradeoff is which 3D printers use. The choice of quality and cost is highlighted in the comparison of industry and consumer grade printers. Industry grade printer are typically bigger and print at a much greater resolution: however, they come with a expensive price tag. While the consumer printers are much cheaper; they have a small print volume and lower resolution. With hundredths of consumer 3D printers available today, the choose may not be an easy or clear one. Productchart.com is a great site that allows you to compare a wide range of printers using two different criteria as the axes. Productchart.com’s picture reveals that 3D printers typically fall in three bands of resolution: 100, 50, and 20 microns. Ideally, the best printer on this graph would be in the lower left corner since that would give you the best resolution for the cheapest price. The website is quite well done and allows you to explore many features.
No Printer Excels in All Areas
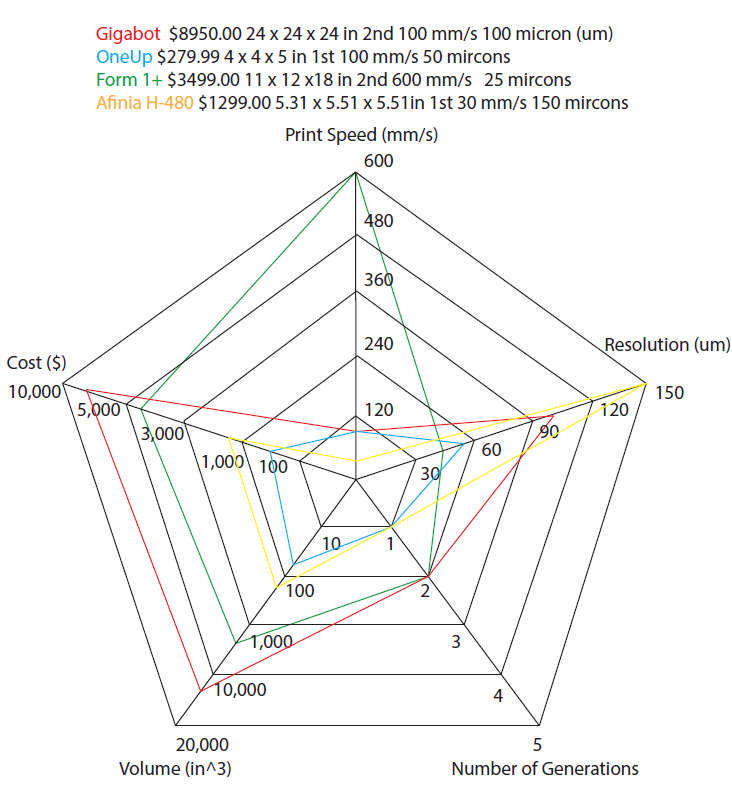
Here is a diagram I created that plots some key characteristics for four printers on a radar chart to show that no single printer excels in all areas, as for normally, the 3D printers excel in one or two areas. For example, Gigabot, one of the largest consumer 3D printer, supports high volume with decent resolution but comes with a high price tag. The Form 1+ develop objects very fast and very fine, while OneUp is one of the cheapest printers on the market today. As evident in the radar chart all of these printer choose qualities to be in top 90% of the market, but made tradeoffs in the other features.
© 2015 Max Murphy
Tradeoffs within a 3D printer
- Resolution or Layer height
- Print Speed
- Fill Density or Infill
- Infill Pattern
- Detailed Optimization
Resolution or Layer height
In 3D printing, resolution describes the thickness of the layer of plastic extruded out. It is a no brainer that finer or higher resolution objects take longer to print than the same objects at a lower resolution. The tradeoff between time and resolution would look like a logarithmic curve in theory. According to the image of the given layer resolution and time the graph resembles a logarithmic curve.
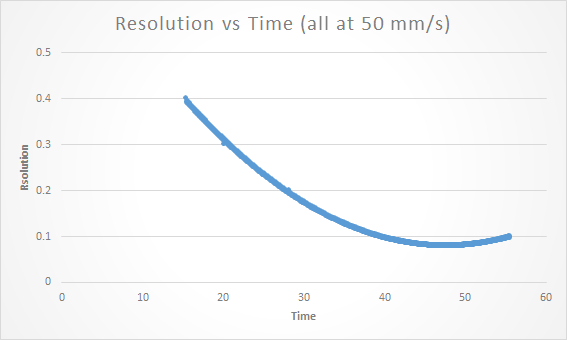
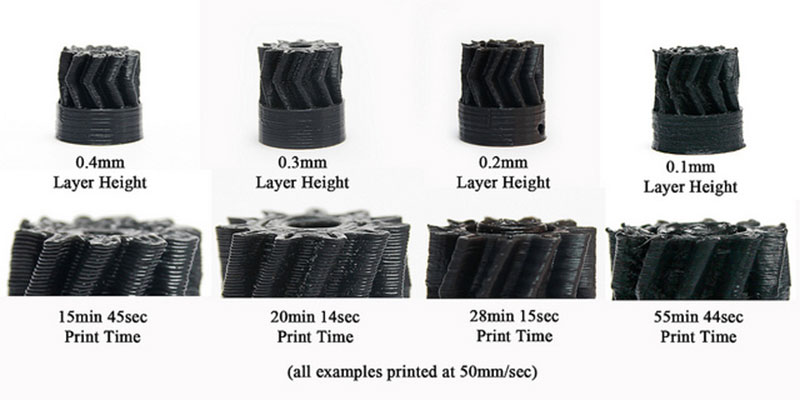
Image taken from here
Print speed
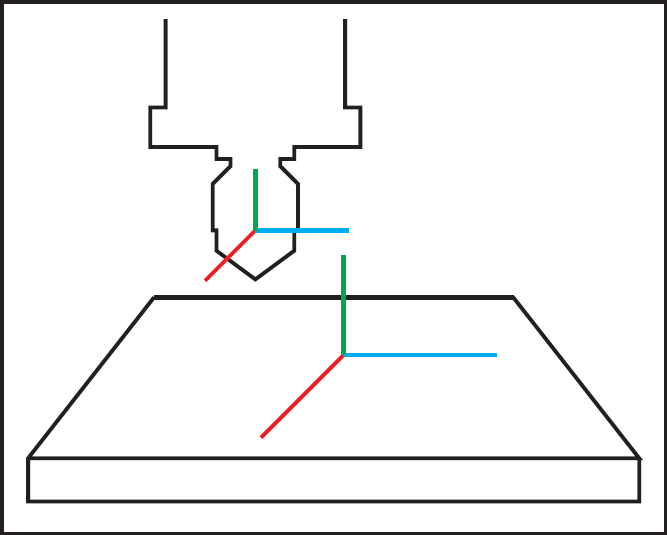
There are two types of speed within the umbrella term “print speed”: the rate at which the filament is deployed on the bed and the rate at which the extruder moves. Most printer movement is on a Cartesian plane or X, Y, and Z coordinate system with either a stationary bed coupled with an extruder that moves in all three direction or the bed move in the Z direction and the extruder moves in the X and Y direction. When printing large objects or multiple objects in one print job, the travel speed of the extruder is a bigger factor in total print, as to the point, it would be interesting to have both the extruder and bed move in all three directions to reduce the travel time.
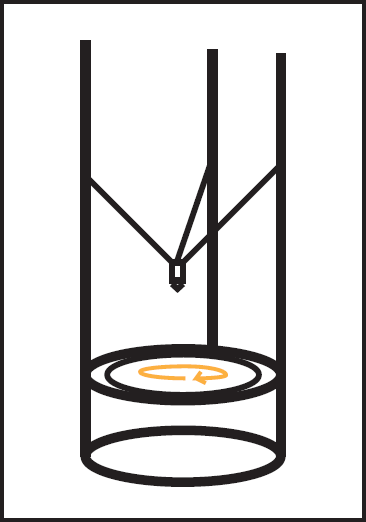
Delta 3D printers resemble the pick and place machines typically having a circular base so to reduce the travel time on these machines have the bed rotate around to reduce the movement of the extruder head. However the rapid movement causes vibration thought out the bed and the machine which could cause misalignment with the object the extruder. It would be interesting to see a tradeoff of speed vs vibration to determine the critical point.
Typical consumer printer move in a range of 50 to 120 mm/s and usually the slower the print speed the better the resolution can be achieve and the print is less likely to fail during the process. Making the rate at which the extruder head move faster won’t be the best solution for reducing the total print time, because the plastic layer must solidify before the next layer is placed. One possible solution to this material science problem would be to have a fan or a head that could cool the hot filament right as it was being laid down to enable the extruder to go faster.
To reduce the total print time requires a solution that must involve a multiple pronged approach of mechanical, material science, and speed constraint is should be approached.
Fill density or Infill
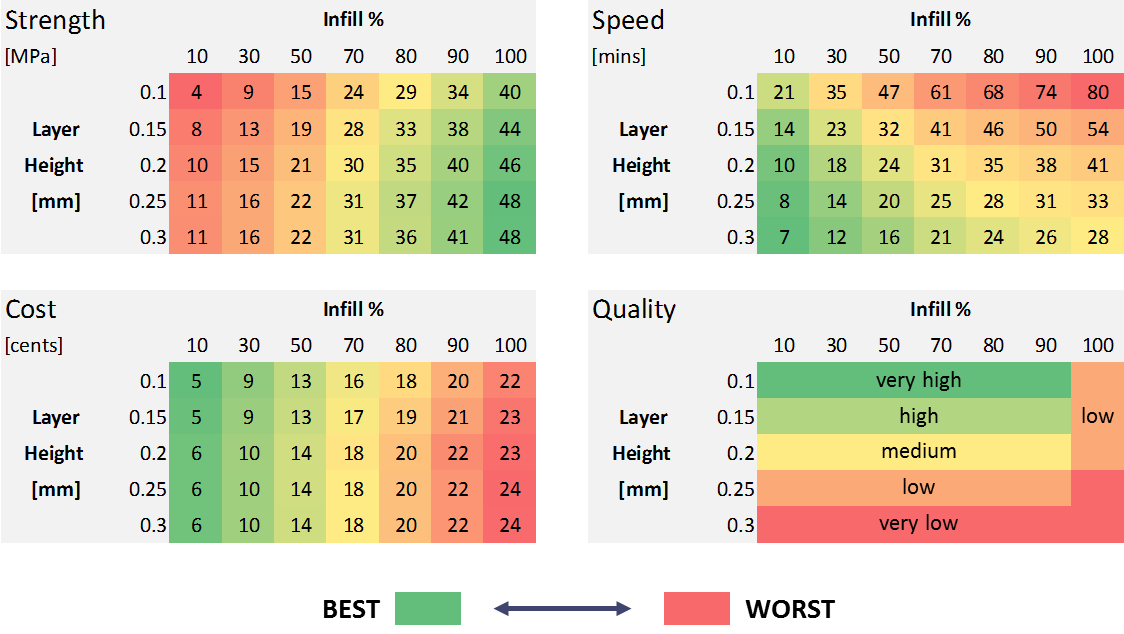
Fill density is the amount, usually determined as a percentage, of the object filled by cross sectional plastics. 0% fill density means just the thin outer wall will get printed and 100% means the object is fully filled. 100% fill density object take a lot more time than 0% fill density object but the solid object is far stronger and durable than the 0%. Nonfunctional parts (such as art pieces, action figures, etc…) are usually between 5-20% and functional parts (such as tools) are usually between 30-70%. This table taken from this article on my3dmatter.com shows which fill density and layer height would best match the requirements for the final product.
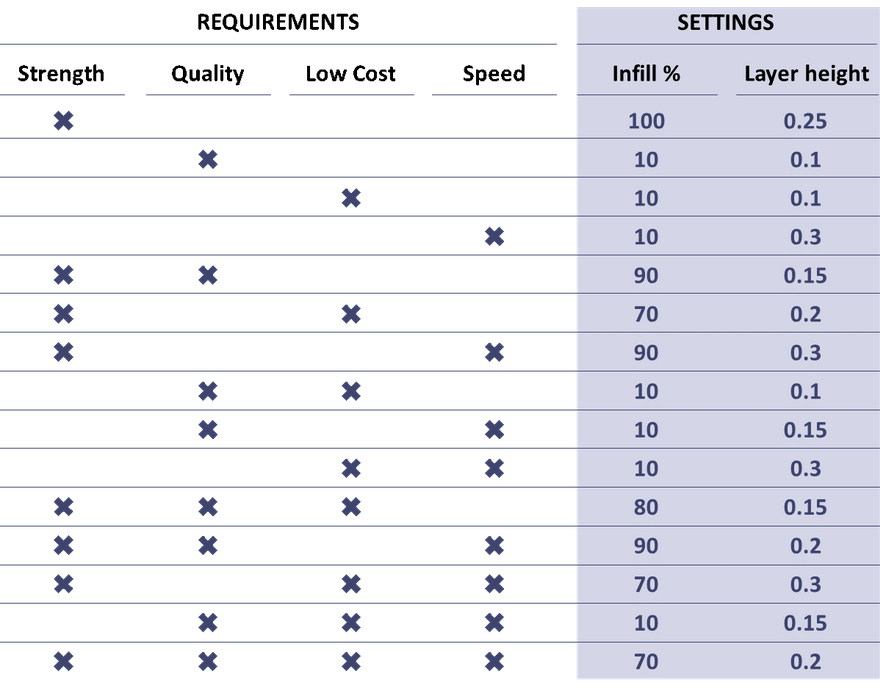
This article is one of the best article I have read during my research because it is one of the few articles that actually uses numbers and data not just pure speculation.
Infill Pattern
Some slicing programs allow for the infill pattern to be changed from the default linear or cross sectional pattern to the following patterns: zig zag, rectilinear, concentric, honeycomb, and Hilbert curve. A more complete list of ones that are possible to achieve by the program, Slic3r, can be found here.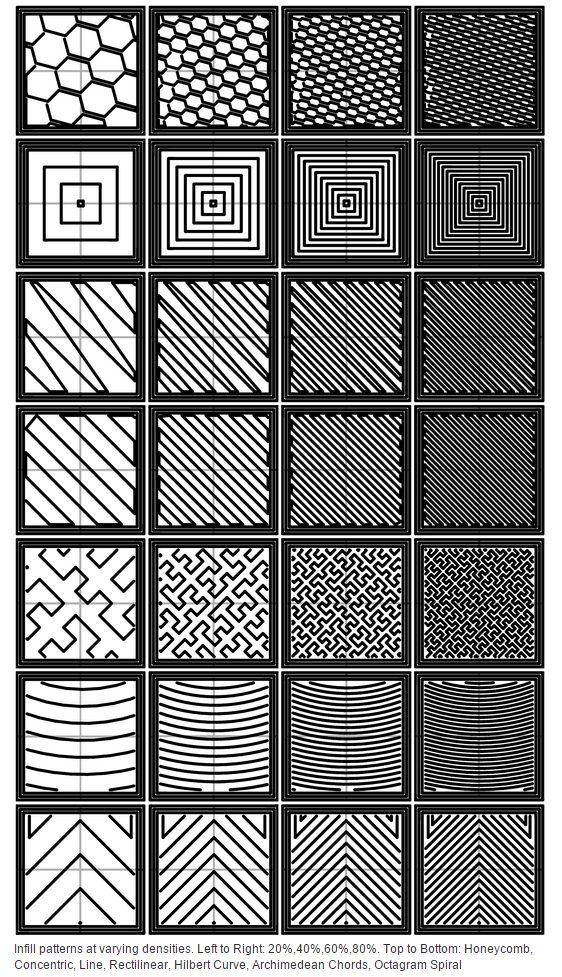
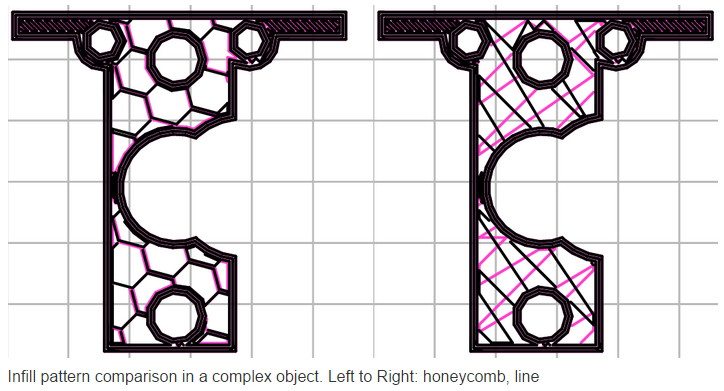
They also found out that, “Certain model types are more suited for a particular pattern, for example organic versus mechanical types. Figure shows how a honeycomb fill may suit this mechanical part better because each hexagon bonds with the same underlying pattern each layer, forming a strong vertical structure.”
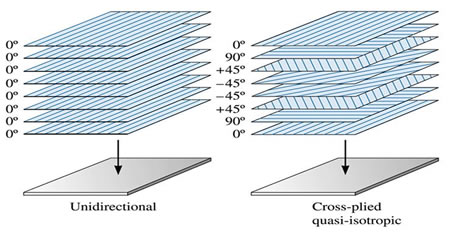
However, the honeycomb pattern causes the extruder head to make a lot of small, sharp turns during the print which cause enough vibrations to make the plastic object and the extruder head to be misaligned. With the zig zag pattern the strength properties are probably better along the grain and weaker perpendicular to the grain similar carbon fiber properties. Carbon fiber is stronger and lighter than titanium along the grain making a great material especially for airplanes; however, it’s very weak perpendicular to the grain. What they do to solve this problem is lay down a layer of carbon fiber then lay the next layer down rotated 45 degrees and repeat until there are four layers of carbon fibers all 45 degrees away from each other. The different orientations of the carbon fiber layers to give it the maximum strength in all four directions. One idea to achieve the strongest possible object simply based on fill pattern would be to rotate the orientation of the zig zag pattern 45 degrees clockwise for new each layer.
Image taken from Arnab Gupta.
Detailed Optimization
A detailed optimization of design could also include selecting the layer height, infill density, fill pattern, and orientation not only for each layer but for different areas on that single layer. One product may need one end to be stiffer and more flexible at the other end. The Autodesk Within CAD program is the first program that I have seen that allows for this kind of design. This idea will get more powerful and involved as 3D printer receive more nanotechnology functionality.
Summary
There are several levels of tradeoffs possible for 3D printing: The first is to determine 3D printing is even the right process to realize your design. If it is there are a sequence of decisions to be made to optimize for one or more key characteristics you want in the final object: strength, speed of printing, minimum feature resolution, and cost. 3D printing optimization requires an understanding of the tradeoffs that different processes and parameter settings offer.
About the Author
Max Murphy is Mechanical Engineering student in his Junior year at California Baptist University. He is interested in the implications of 3D printing (positive manufacturing) for mechanical design. He is currently an intern at Soundfit, one of the companies that is part of the Bay Area Advanced Manufacturing Hub (BAAM), where he is gaining hands on experience with a 3D printer and scanner and an intern at Neodyne Biosciences working with the R&D and Q&A departments.
Pingback: My new domain for 3D printing blog posts | 3D printing
Pingback: Biomimicry With 3D Printing of Shapes and Surfaces | 3D printing
Pingback: 4D printing | 3D printing