
Mark Graban gave a great talk at last year’s Lean Startup Week on how to avoid wasting your time–and your team’s time–looking for meaning in normal fluctuation. Here are some highlights.
Mark Graban: Don’t Waste Time Looking for Meaning in Normal Fluctuation
The full transcript is available at Mark Graban: Distinguishing Signal From Noise
A Real Example: New Premium User Registrations
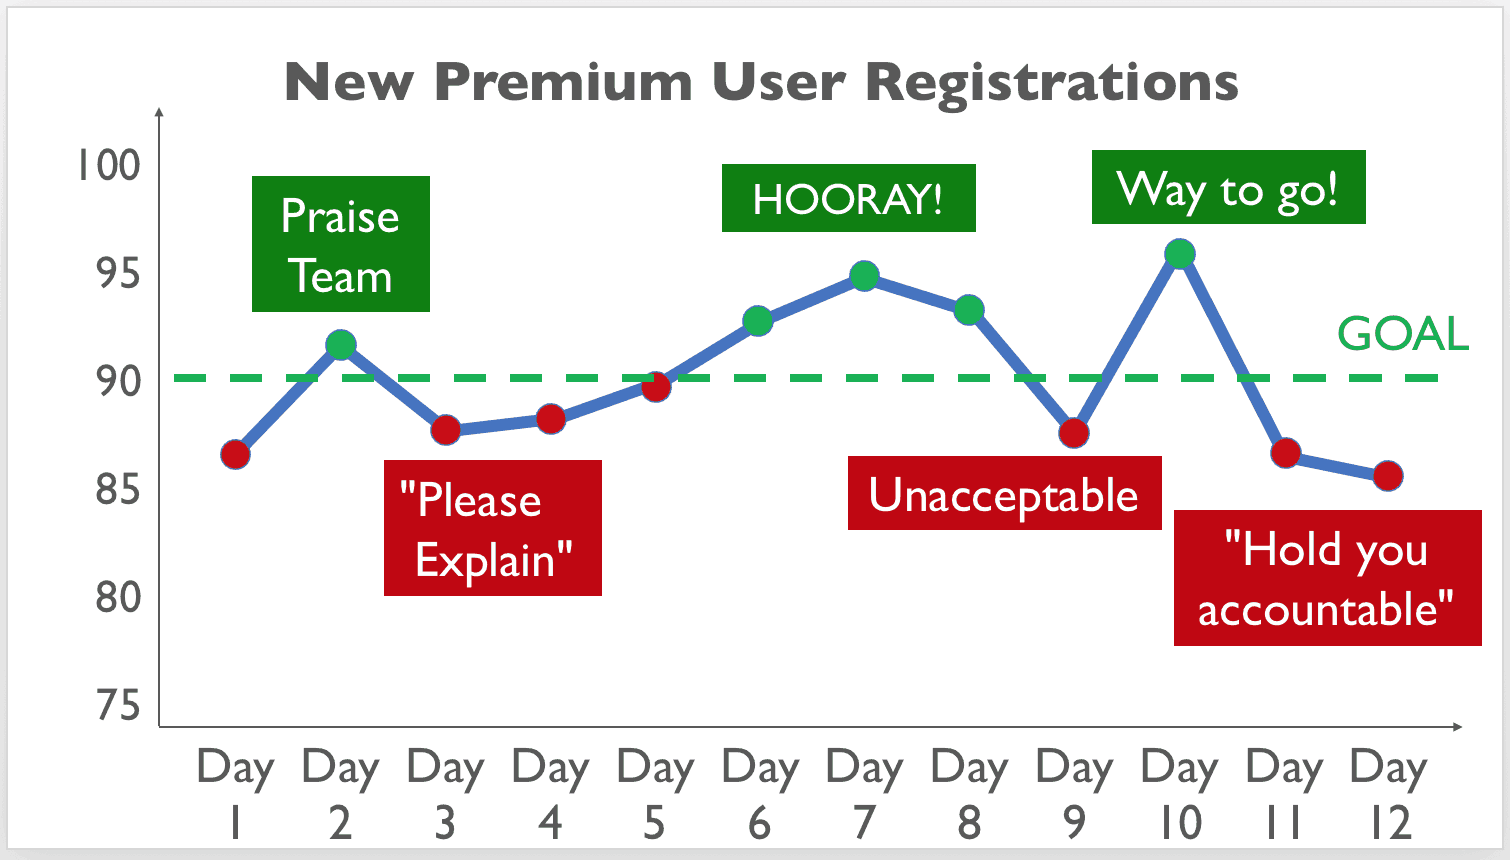
Let me share an example that’s very typical of different organizations I’ve seen. We might have a metric, new premium user registrations. That might be core to our business model. We have a data point of about 86.
A well-intended leader might look and say, “Well, we need to set a goal. I want better performance, more success. I’m going to set a goal of 90. I’m going to communicate this to the team.”
We come back the next day. We see, good, we have an uptick. Performance is better. We’re above the goal. We color that green. We praise the team. We maybe pat ourselves on the back too as leaders because good for us setting that goal. We motivated people.
We come back the next day. We see performance has dropped. Know what happens in a lot of situations like this is you might get an email that goes out with a real terse, “Please explain.” Email like this takes maybe 30 seconds to send out. The response to that email might consume hours and hours of people’s time, discussions, meetings, research, looking for an answer that might not really be there.
By the time they’ve gone through that, we see performance has inevitably improved. It’s gone up. We’re above the goal. We celebrate. Then performance drops. We tell them team, “Well, this is unacceptable.” We maybe start to think, “Well, every time I praise the team, they start slacking off. I’m going to quit praising them.”
Performance gets better. We say, “Way to go.” Then things drop. We start throwing around phrases like, “We’re going to hold you accountable.”
Reality: New Premium User Registrations are Fluctuating in a Range
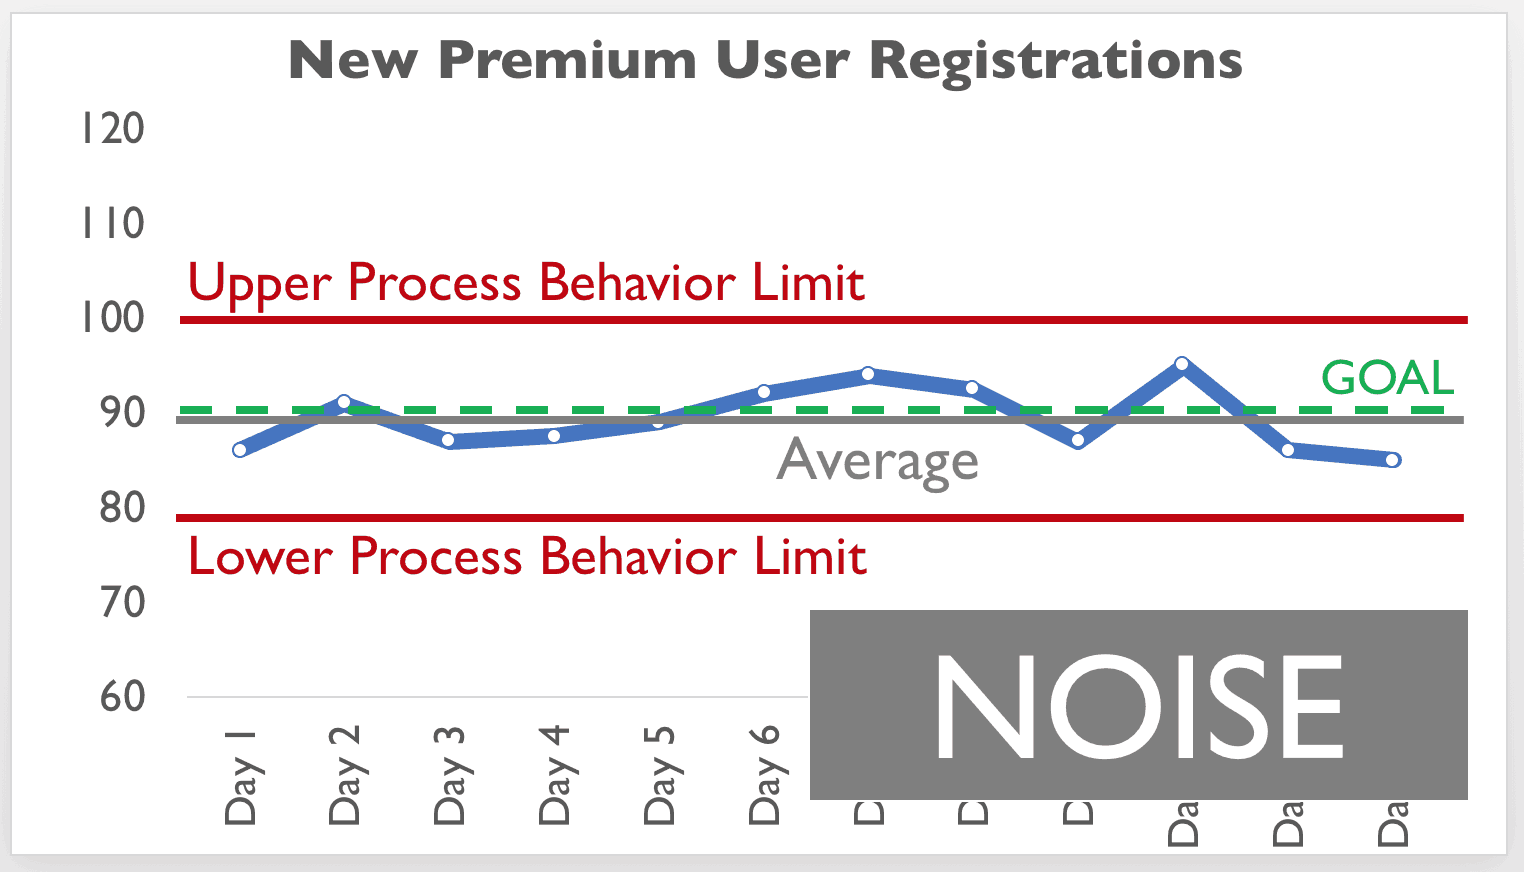
When we step back and look at this data in context, we see maybe it’s just fluctuating around an average. The same system, the same people doing the same work are going to generate different results in different time periods. As hard as that might be to accept, it’s true.
A lesson we learn from a statistical approach to metrics is don’t waste time explaining noise. Don’t ask people to explain noise in the data because, more often than not, there is no root cause for that noise. Asking why five times or six times or twelve times won’t necessarily lead to a single magical root cause that explains that performance.
A book I highly recommend, it’s called Understanding Variation. This is a core book on this methodology. Don Wheeler who wrote this says:
“While every data set contains noise, some data sets might contain signals. Before we can detect a signal within any given data set which might any metric that we’re following and tracking, you must first filter out the noise.”
Don Wheeler in “Understanding Variation“Any time spent asking, “Why did we have a bad day? Why was there a good day?” is more than likely a waste of time. It distracts people from the effort we might put into actually improving performance, better understanding our system instead of just being really reactive.
SKMurphy Take
Mark Graban correctly points out how metrics can lead you badly astray if you don’t put some bounds on your observations and expectations.
I have to keep reminding myself to plan for three tries at an improvement effort: nothing new ever works the first time and always requires fine tuning. Many things just cause side effects without creating the main improvement you are aiming at. When you are dealing with people–for example running a promotion or trying a new message–there are always lags that distort and delay the impact, making it harder to measure.
There are different ways to draw the process bounds but the two simplest are a two sigma and a three sigma variation bar. Take the average of the data in the series and plot that as constant line and then plot upper and lower bounds at plus and minus either two standard deviations (sigma) or three. If the data departs from the two sigma bound the odds are 95% you have a real deviation (as this should happen only 5% of the time for a normal distribution) and if it departs the three sigma bound the odds are about 300 to 1 (99.7% of the variation in a normal distribution is contained in the -3 sigma to +3 sigma range).
If you suspect your data is not normally distributed–or just want to be more conservative–you can rely on Chebyshev’s Inequality which applies to a wide range of distributions: here a two sigma variation should only happen 1/4 of the time and a three sigma variation 1/9 of the time. The point is that until the metrics depart from the “normal fluctuation” bounds you are looking at noise and not effect.
Note: Mark Graban goes into more detail on mechanics of calculating 3 sigma control bounds and how to interpret them in “How to Create a Control Chart for Managing Performance Metrics”