
A chalk talk on the S-Curve model for Technology Investment. The S-curve was first popularized in “Innovation the Attacker’s Advantage” by Richard Foster.
Chalk Talk: S-Curve for Technology Investment
I just finished a chalk talk on the S-Curve model for Technology Investment. This is a model that I have been using with clients and in talks since my Dec 2006 “12 Books for the Busy CEO” when I highlighted the S-curve model as an organizing paradigm. But I have never really explained it well on the blog until now.
Edited transcript: I want to talk today about the S curve for technology investment. This curve is a model of the impact of research and development efforts on new technologies, products, and processes.
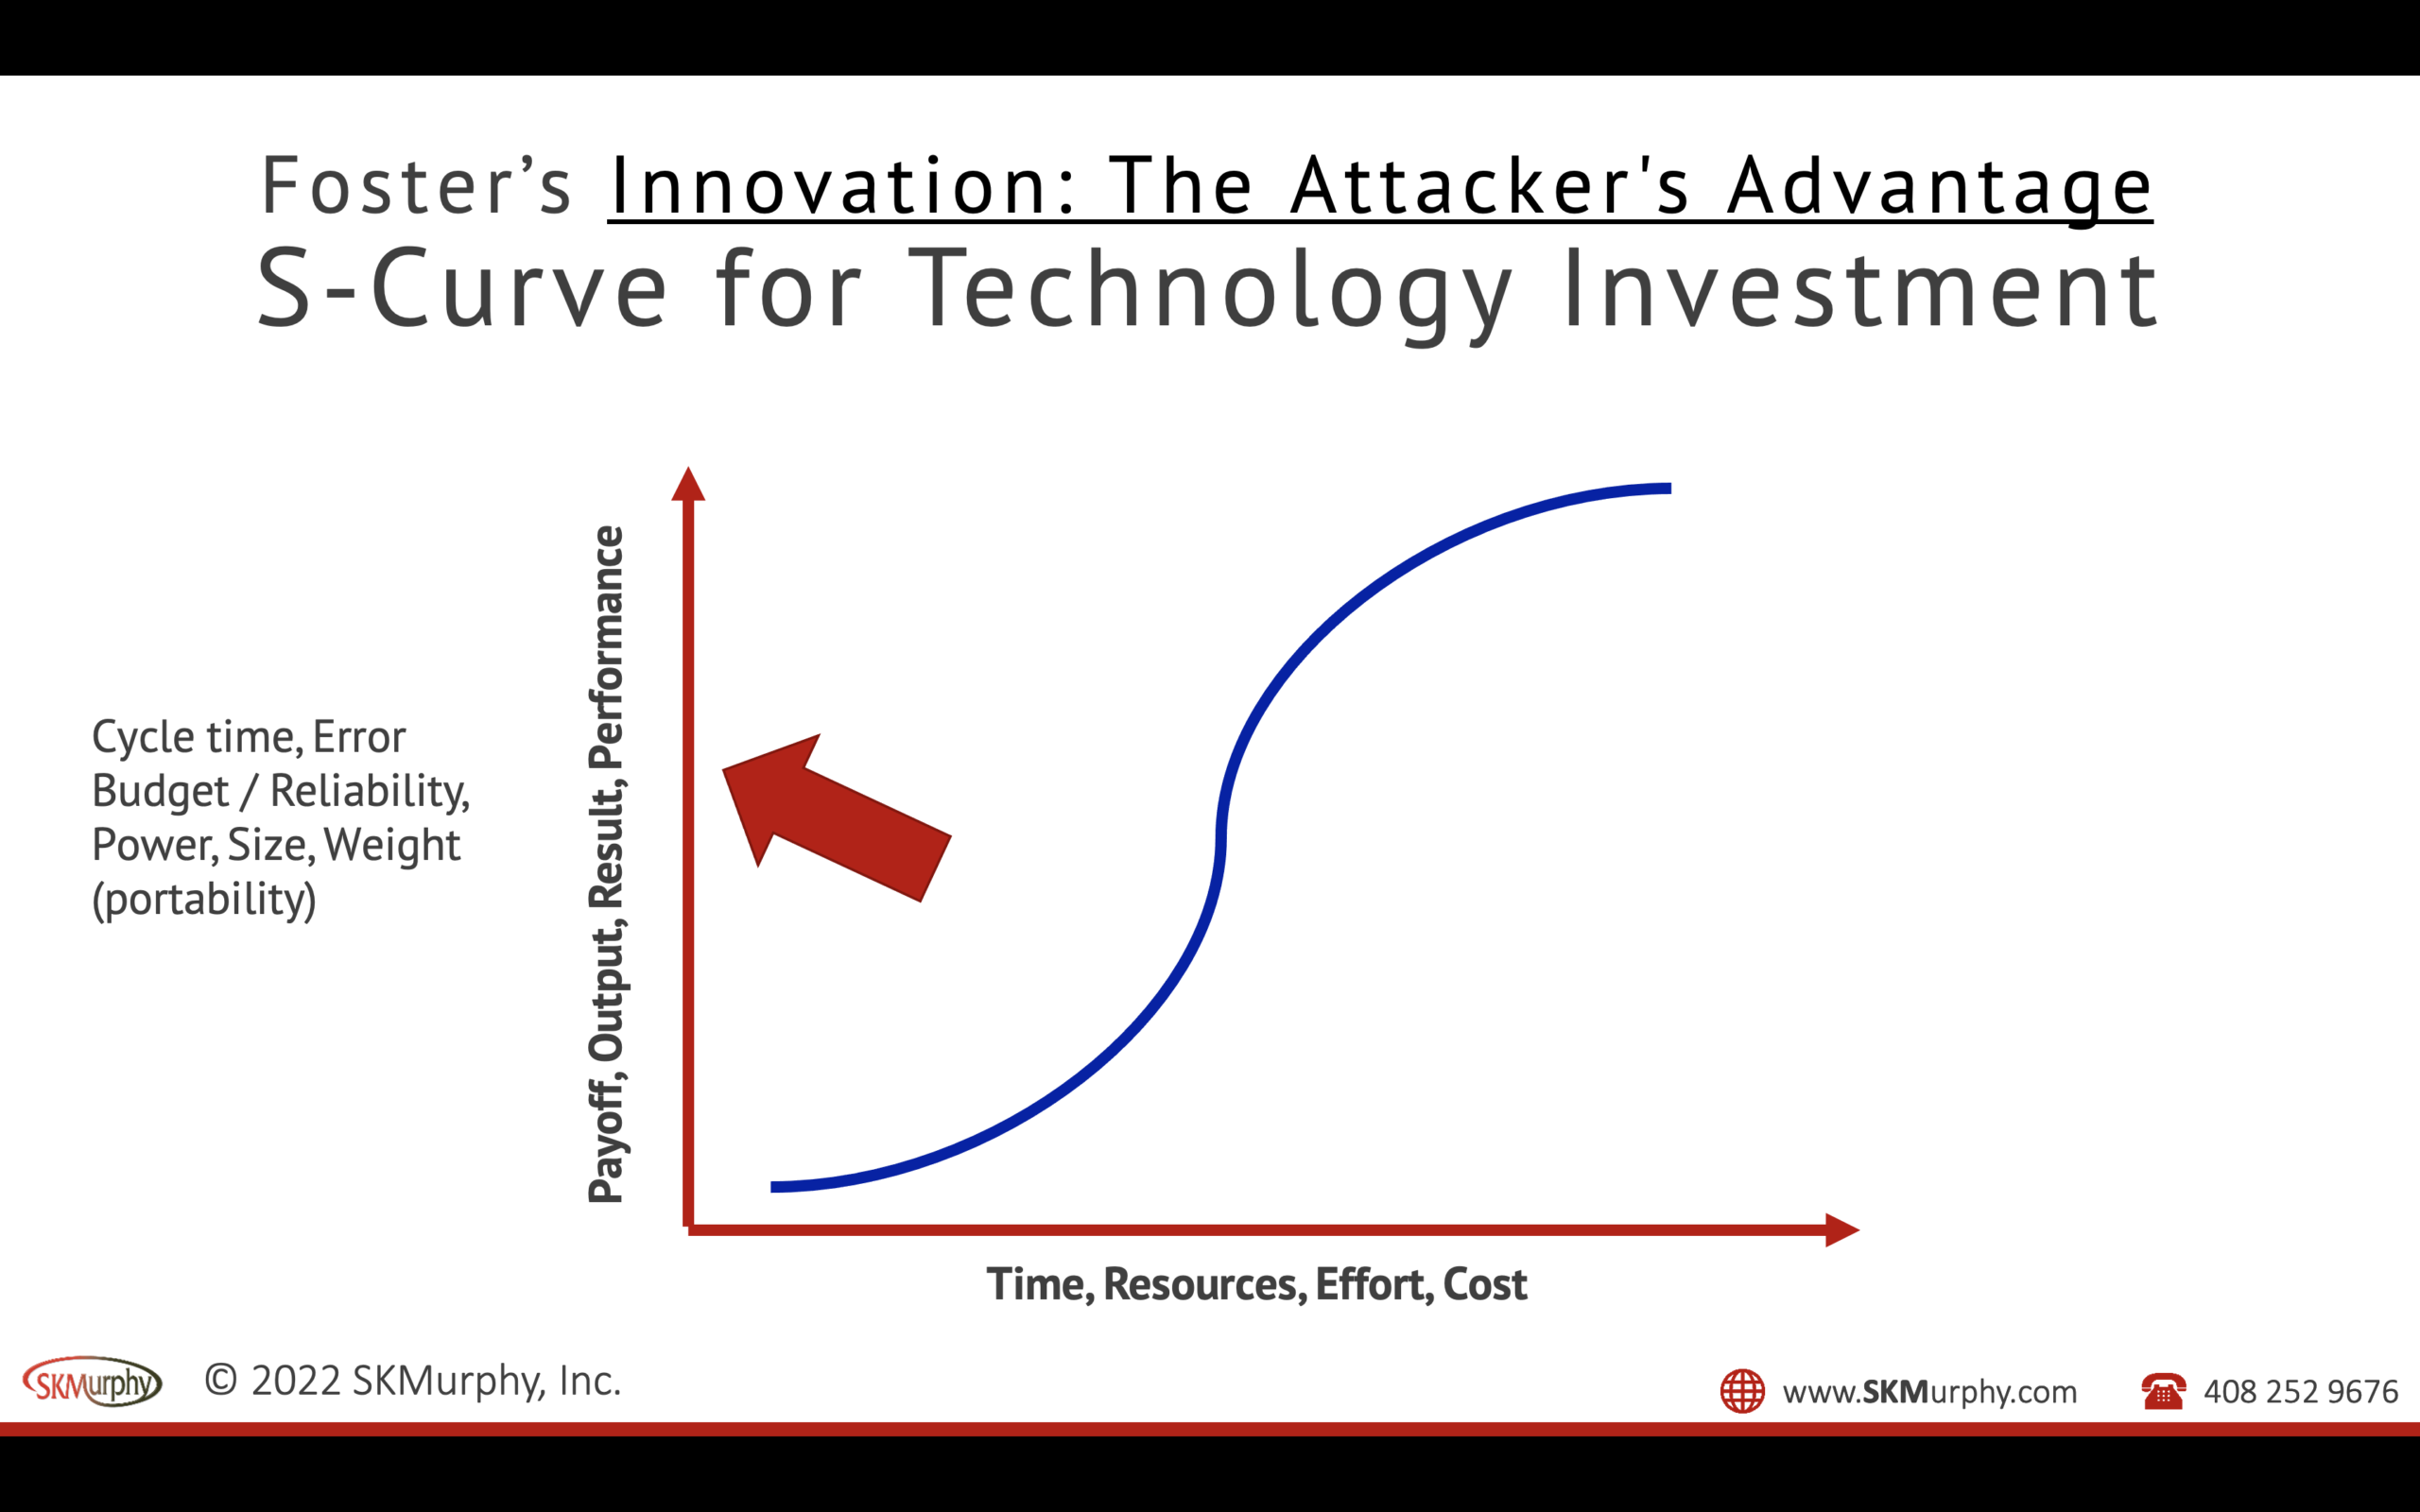
The vertical or Y-axis is the relevant measure of the performance of the technology you are trying to improve. This performance is what the customer is paying for: this might be a reduction in cycle time for a task, a reduction in the rate or severity of errors (making results more reliable), cutting power consumption, or reducing size or weight to increase portability.
The horizontal or X-axis is a measure of the effort that’s needed to effect an improvement. This effort might be measured in man hours or dollars. How much money and effort was needed for the performance improvement you have effected?
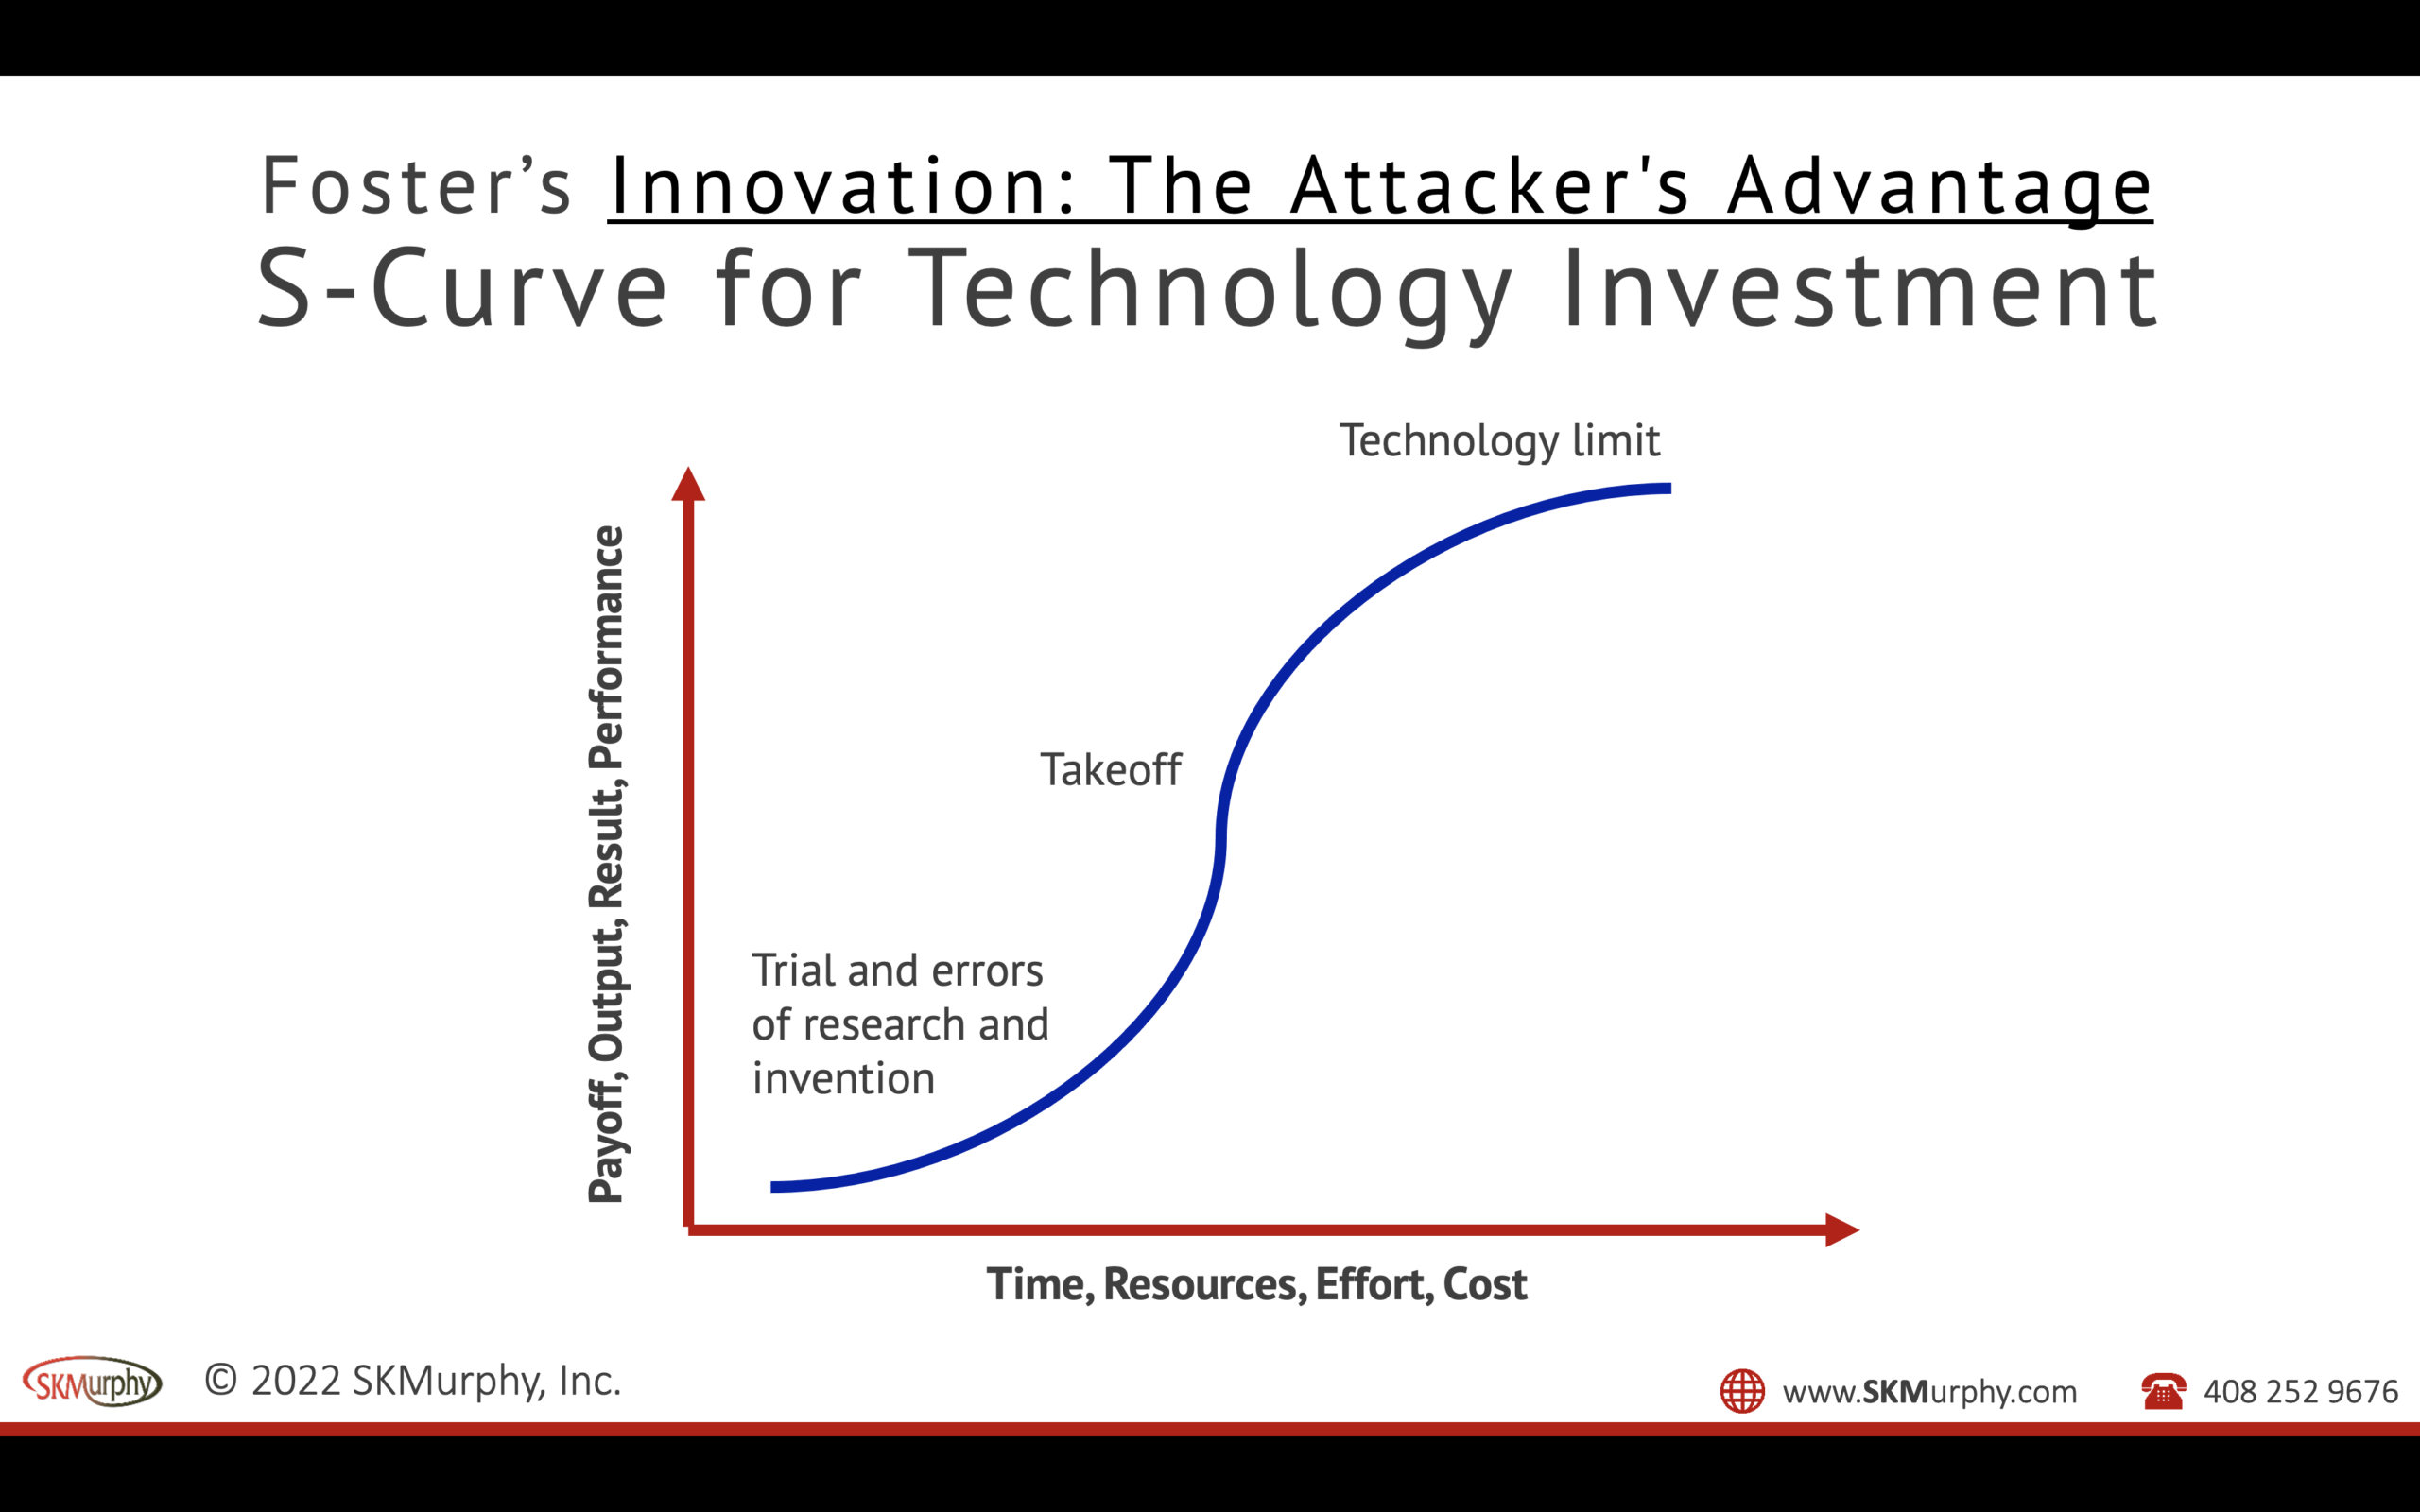
In the beginning, improving performance requires considerable effort. You often start from early research results or an accident that gives you a glimpse of what is possible. What comes next is a lot of exploration and experimentation: trial and error. And the most likely result o any one trial–and the reason why that curve is so flat–is that you learn another way that probably won’t work.
Edison went through this as he searched for a long-lasting filament for his electric light. At one point associate observed, “Isn’t it a shame that with the tremendous amount of work you have done, you haven’t been able to get any results?’ He said, “Results! Why, man, I have gotten a lot of results. I know several thousand things that won’t work!” So that’s the research phase.
At some point, a trial may yield an improvement. This improvement may give you a deeper understanding of how the technology works, or it may be a better point of departure for further experimentation. Eventually, things start to come together, and you see how to achieve more predictable improvements from an incremental investment of effort. Now the curve begins to take off as you transition from trials that are primarily research to iterations that are predominately development and refinement. Your results are more predictable, and more of the time, they yield some improvement.
As this continues, and you continue to refine and improve the technology, you find it challenging to make significant progress. You can still wring out gains, but they are smaller and smaller. You are hitting physical or other limits in the technology or process.
So why is the S-Curve important?
The S-curve gives you a heuristic or rule of thumb for technology investments. In the beginning, you have to do research to gain a better understanding. Then, at some point, you start to see more rapid improvement. Over time, the rate of improvement slows until it hits a limit.
How do you tell where you are on the curve?
Keep track of your past efforts and the results that they yielded.
- If most of your efforts are not delivering any improvement but sometimes yield a significant jump in performance, then you are doing research.
- If you can routinely predict what efforts will yield results, then you’re doing development and are in the middle two-thirds of the curve.
- If you had been making progress reliably, but it’s now slowed down considerably despite continued investment, then you are probably hitting limits.
Stacking technology innovation
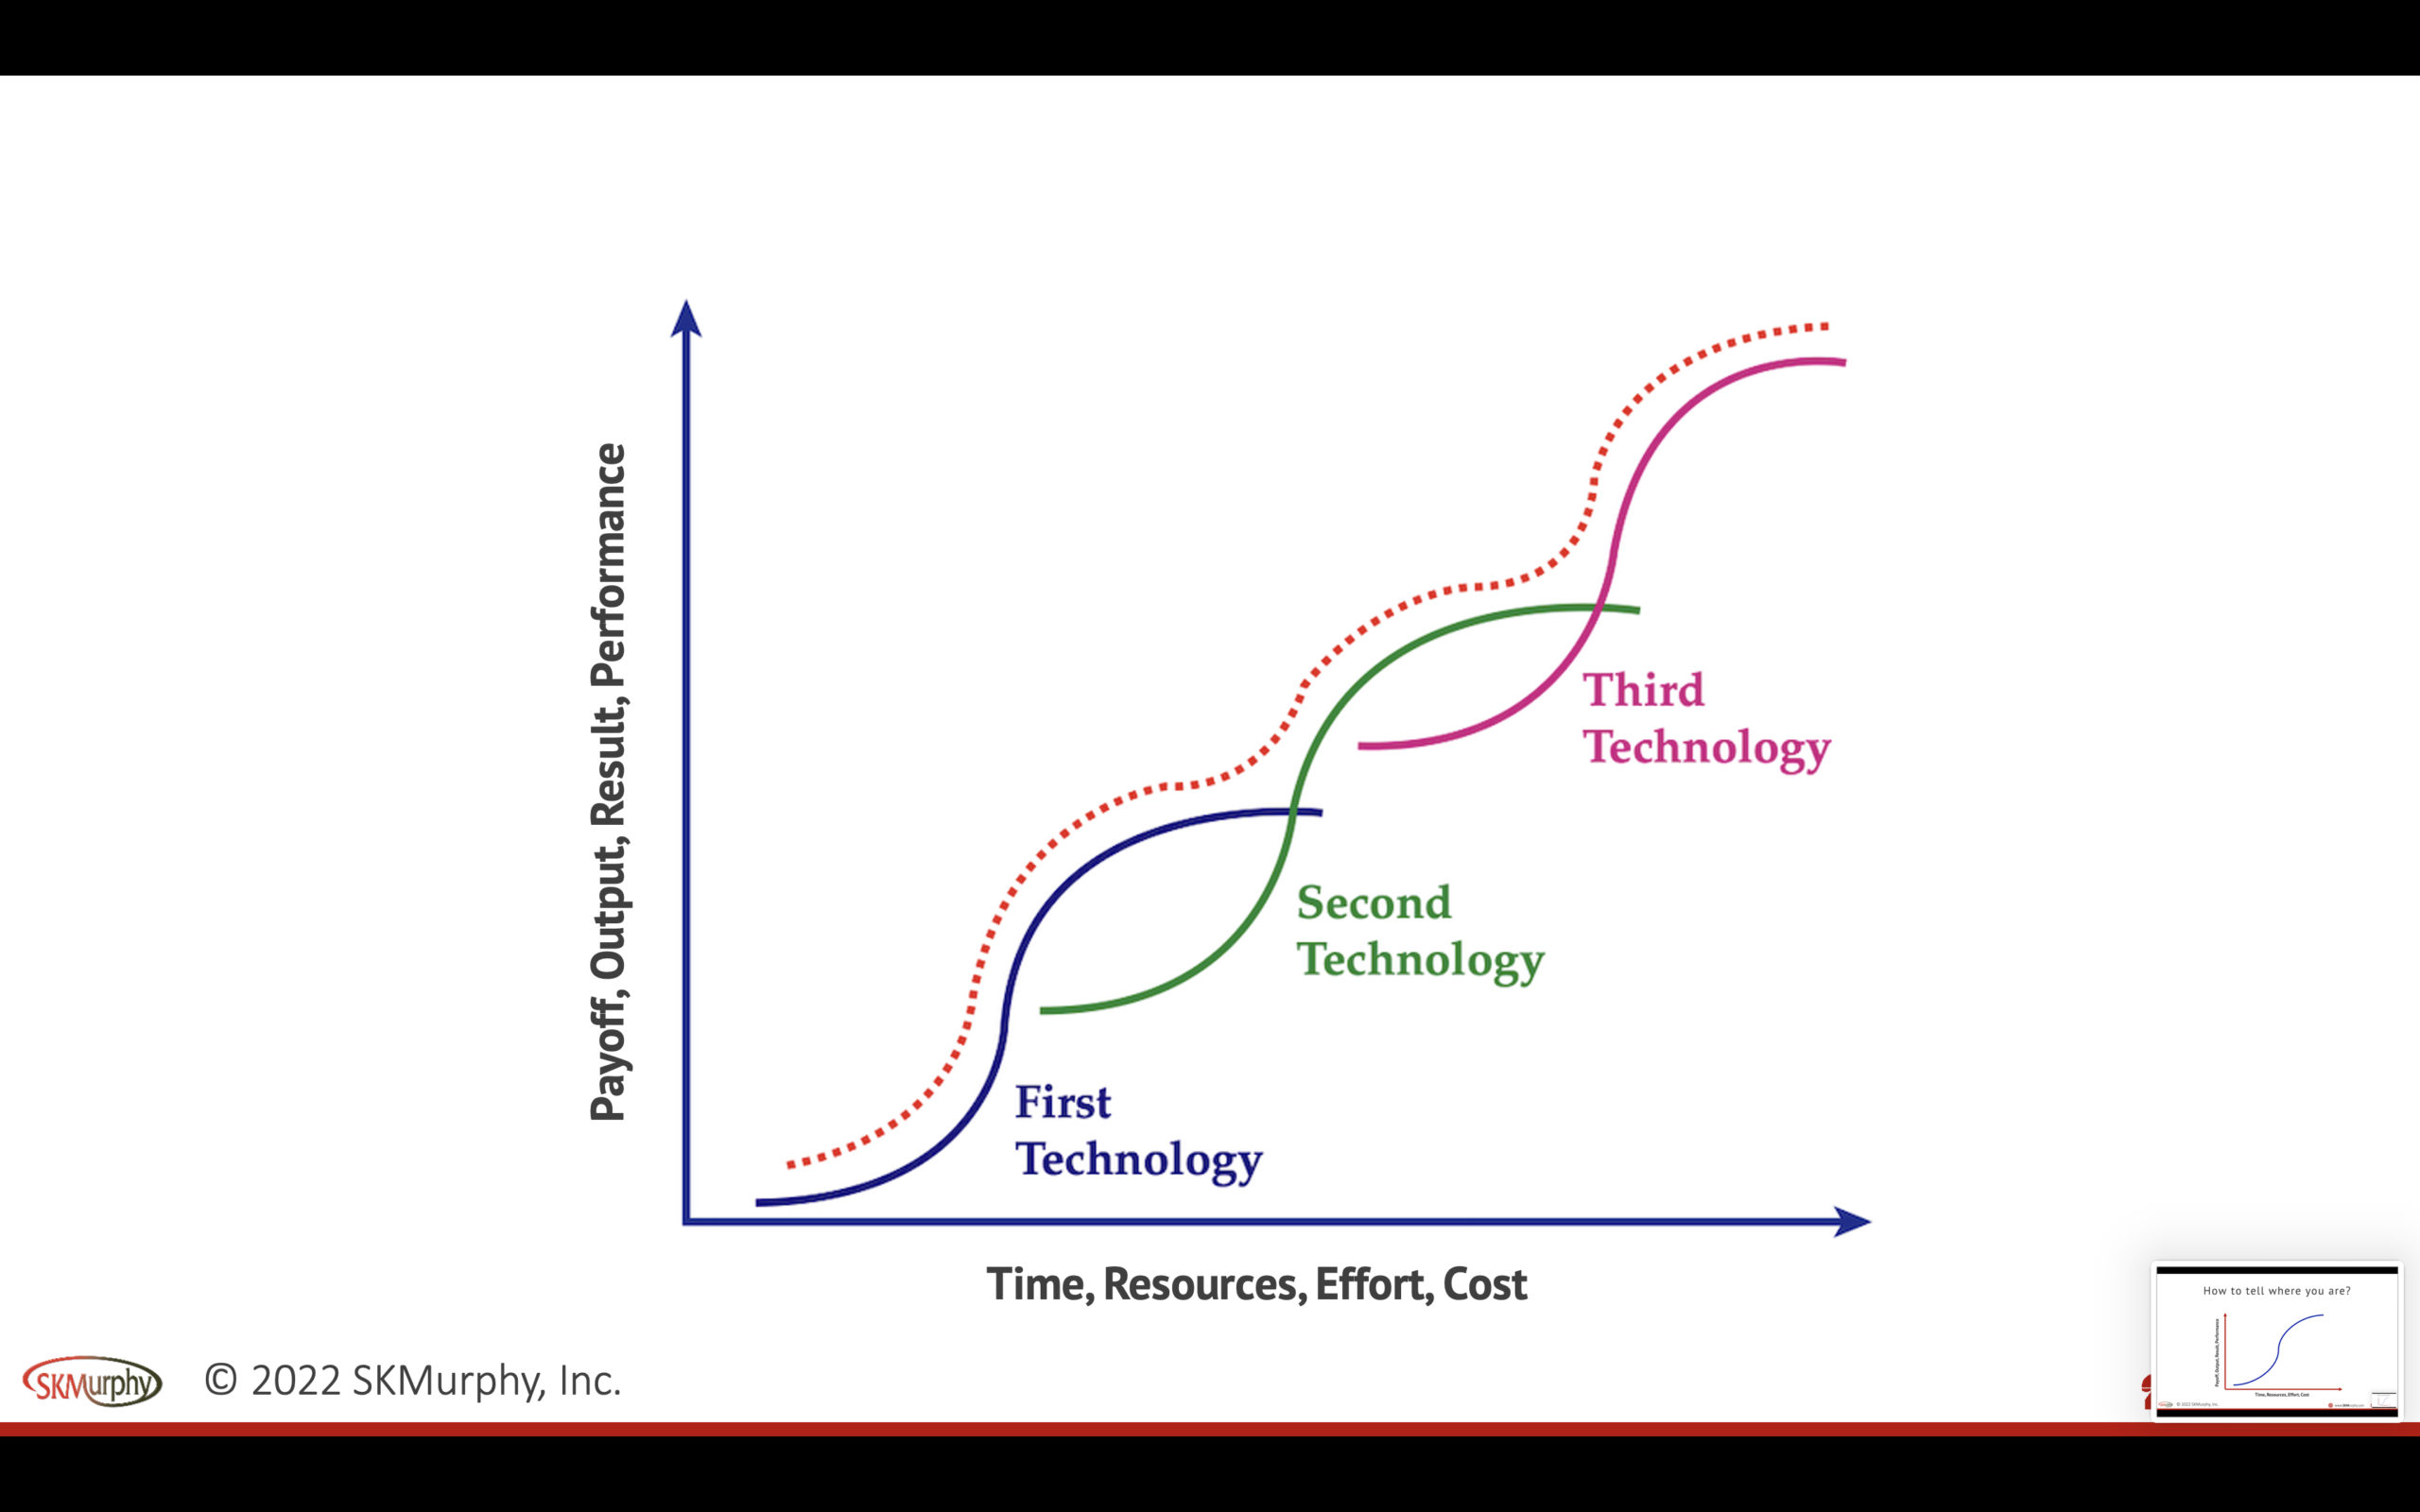
What normally happens is that a series of technologies are integrated into a product: as one technology starts to hit a limit, you investigate and incorporate a second, and then a third.
Stacked S-Curve Example: Spreadsheets
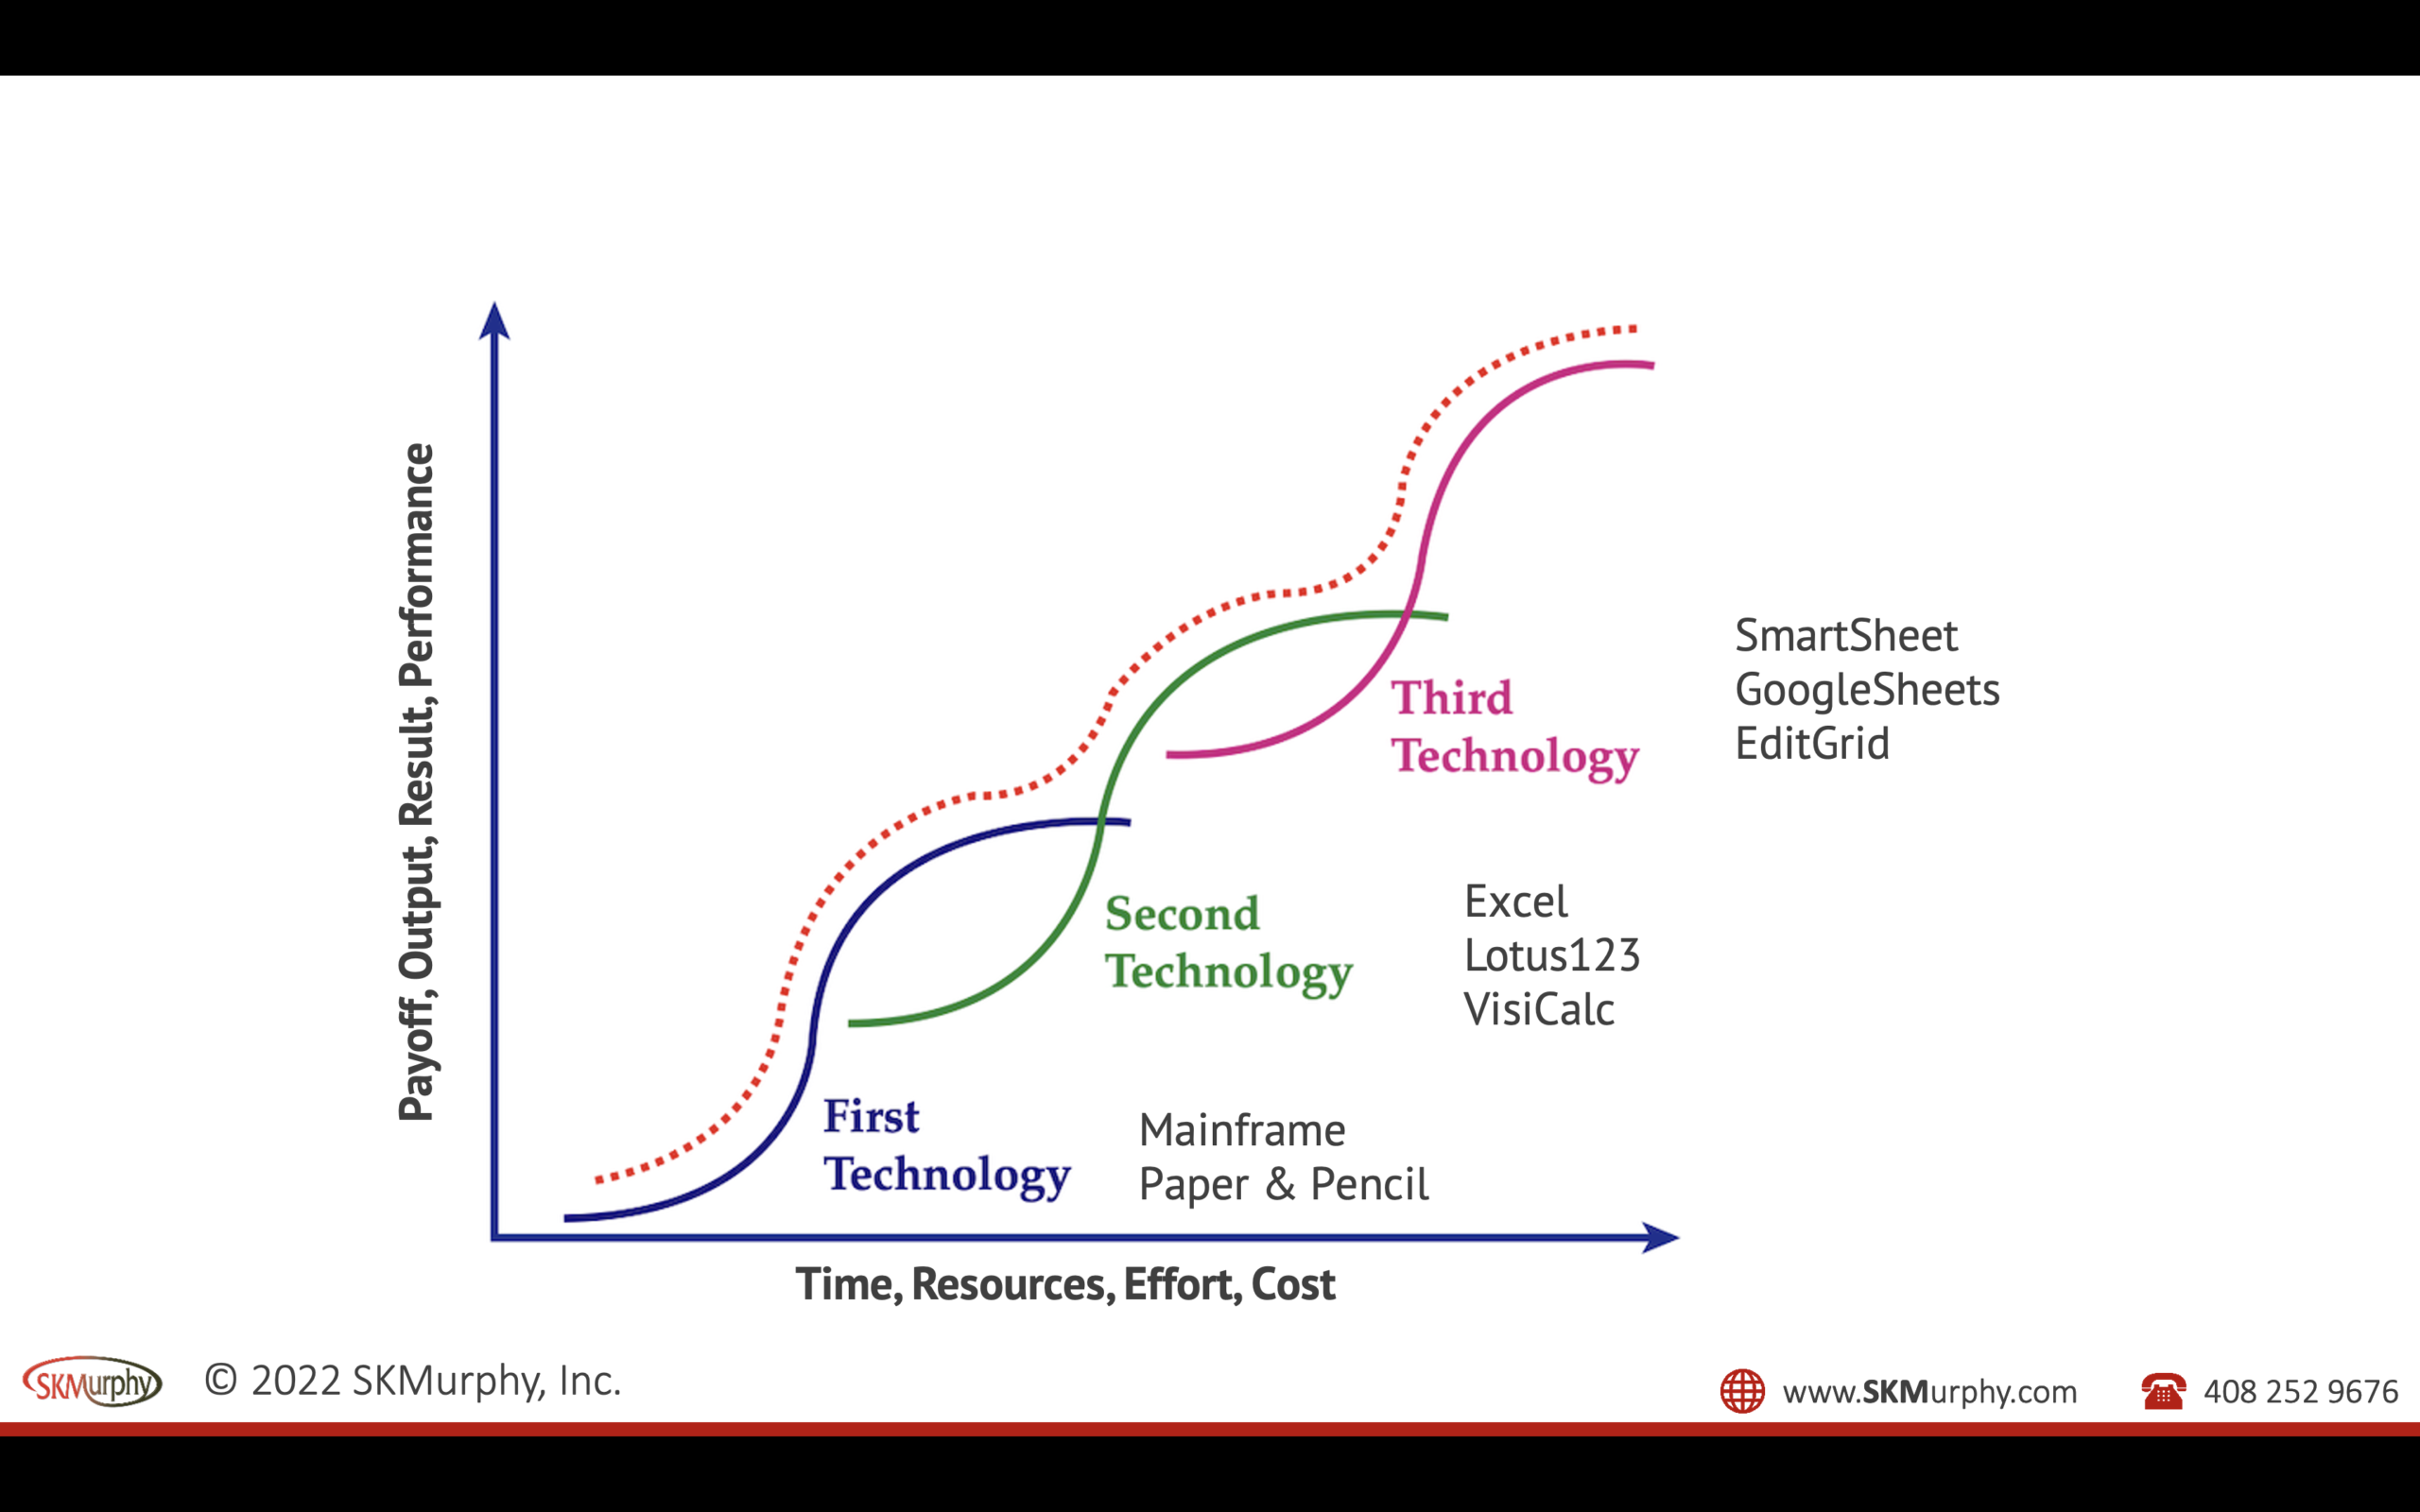
Let me give an example of this from spreadsheets. Spreadsheets were initially implemented using pencil and paper as accounting ledgers. The spreadsheet paradigm for planning (as distinct from bookkeeping) is at least 100 years old. The first generation of automation was mainframe batch tools in the early 1960s that allowed you to define the rows, columns, and calculations. You could change the inputs–exploring options or updating based on new information–and see the table recalculated without having to do it manually.
The challenge was that you had to do a lot of mental translation needed between the language you were writing the model in, and the representation of the Tableau or the spreadsheet. Released in 1979, VisiCalc represented the first of a series of PC-based “visible calculators” that allowed you to make edits in context and see updates after every change instead of having go through a batch process. This was approached proved very popular but was predicated on a single user making edits.
But people wanted to collaborate on spreadsheets, initially just two or three individuals but ultimately at a team or group level. So spreadsheet files were hosted on shared file servers or shared drivers, but the underlying programs were still in “single user mode.” That led to an unsatisfactory “he who saved last saved best” situation where work could be lost or overwritten. This was more likely to happen when multiple people were trying to make updates, e.g., a team was working against a project deadline or closing financials.
That led to the third generation of tools that still leveraged the row and column arrangement from paper and pencil spreadsheets and the “A1 notation” that the PC tools used but could support multiple users making edits simultaneously from a web browser. Examples include Edit Grid, Google Sheets, and SmartSheet. The dotted line shows the evaluation of the technology paradigm from the customer’s point of view over time.
Related Blog Posts
- Twelve Books for the Busy CEO, Mon-Dec-11-2006 at SDForum (slides are here https://www.skmurphy.com/f/SDForum061211.pdf )
- Kurt Keutzer on Engineering Entrepreneurship & EDA He uses Foster’s S-curve to offer a perspective on EDA.
- Do Something Small But Useful Now Bob Bemer’s recipe for progress in the early stages of a new technology.
- Jeff Allison: How To Blend New Capability and New Product Development Talk is Mapping New Capability Development to New Product Design and Delivery
- Startups Should Focus on Impact and Innovation Before Growth
- Scott Berkun: How to translate observations and creative insight into a solution
- Bill Buxton: “The Long Nose of Innovation” [Revised-PDF] explores the early flat part of the S curve, estimating it at 10-20 years for many technologies.
- Tom Malone and John F. Rockhart in “Computers, Networks, and the Corporation” suggests that a new technology initially provides a cost reduction, followed by an increases in the cost-reduced activity, ultimately creating new structures that make intensive use of the technology.
- Chalk Talk on Technology Adoption How to get customers to adopt your new technology.
Political and Regulatory limits vs. physical or other intrinsic limits to technology improvement
- Joel Mokyr on Creative Forces and Cardwell’s Law
- Innovation Often Obsoletes Assumptions, Political Boundaries, and Work Process
- Changing Management’s View of an Innovation From “Probably Not a Good Idea” to “We’re Late”
Spreadsheet related
- Wikipedia: “paper spreadsheets“
- D. J. Power: A Brief History of Spreadsheets
- Richard Mattessich: Spreadsheet:Its First Computerization (1961-1964)
- Dan Fylstra VisiCalc: Design Tradeoffs in the First Electronic Spreadsheet (2004)
Two articles suggested by my readers
- S-Curves for Trend Forecasting by Matt Goldenberg
- The S-curve is a fundamental pattern that exists in many systems that have positive feedback loops and constraints. The curve speeds up due to the positive feedback loop, then slows down due to the constraints.
- The S-curve pattern is quite common in the spread of ideas, practices, and technologies, although it rarely looks quite as pretty. The positive feedback loop in this case is word of mouth, and the constraints represent fundamental barriers to certain market segments or growth such as simplicity, usability, scalability, price, etc. see Wikipedia on Diffusion of Innovation
- In addition to Diffusion S-curves in technology, ideas, and practices, there are Evolution S-Curves. These represent the increase in the traits of these ideas that make them usable in more situations and desirable for more people. When you break through a constraint in one of these properties through innovation, this can often coincide with “unlocking” a new diffusion curve by opening up a new market that wouldn’t previously have used your technology or idea.
- Invisible Asymptotes by Eugene Wei
- Every successful business goes through the famous S-curve, and most companies, and their investors, spend a lot of time looking for that inflection point towards hockey-stick growth. But just as important, and perhaps less well studied, is that unhappy point later in the S-curve, when you hit a shoulder and experience a flattening of growth.
- One way to identify your invisible asymptotes is to simply ask your customers. What you should hear when customers say they want a faster horse is not the literal but instead that they find travel by horse to be too slow.
- Related What Clayton Christensen Got Wrong by Ben Thompson